The NTFL research group conducts growth and characterization of a wide variety of materials. This page will house recent and/or exciting reseach information and images pertaining to our material growth.
We welcome everyone to contact us in regards to possible collaborations that involve our growth and characterization instruments and expertise. Please contact Dr. Charles Parker, Erich Radauscher, or Steve Ubnoske from the Lab Members contact page by email or phone to discuss.
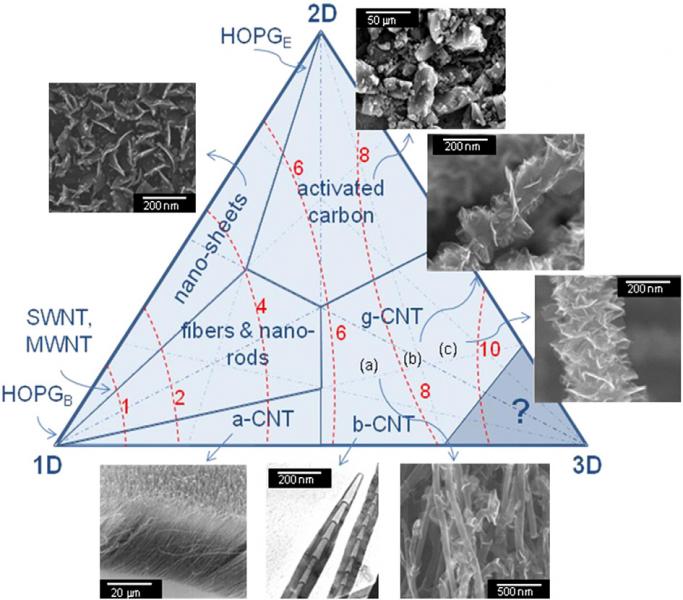
Charge Density Diagram for Carbon Nanostructures
Carbon Nanosheets
Recent developments in our microwave plasma-enhaced CVD synthesis of carbon nanosheets has revealed that it is possible to synthesize sheets with just one or two layers of graphene at the edges of the structure with this method. This material's Raman spectrum also suggests the presence of graphene, possessing a D/G ratio less than 1 and a sharp G' peak below 2700 cm^(-1).
Bilayer Graphene Edges on Carbon Nanosheets:
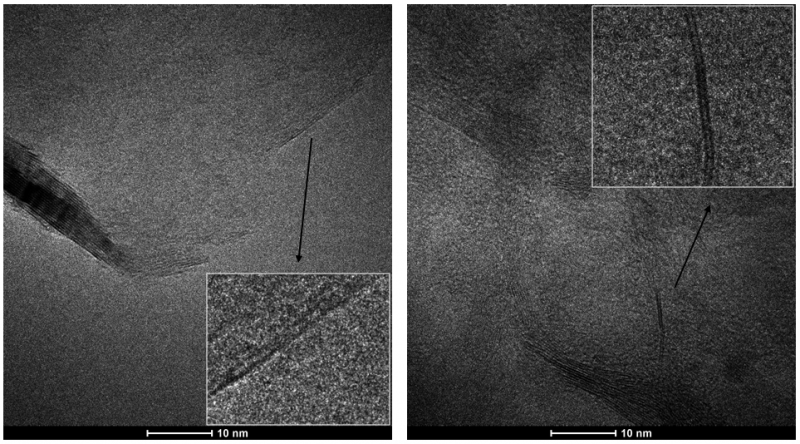
Secondary Sheet Formation from a Defect and Reduction to Single/Bi-Layer Graphene at the Edge:
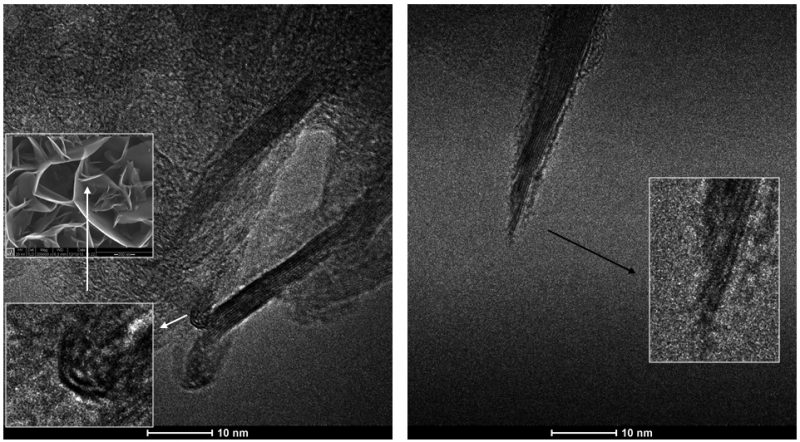
Graphenated Carbon Nanosheets (g-CNTs)
g-CNTs have been grown with MPECVD. The graphitic foliates nucleate on the CNT surface during deposition and appear uniformly along the length. g-CNTs can be grown with consistency and controllability with respect to shape, size, density, and other morphological properties for both the CNT framework and the foliate structure.
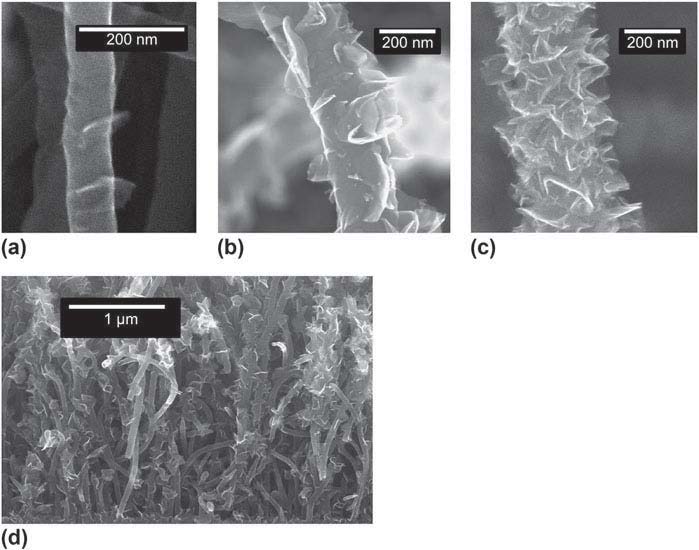
(a) Low-density graphene foliates on a CNT. (b) Medium-density graphene foliates on a CNT. (c) High-density graphene foliates on a CNT. Structures were reproducible and observed over several square centimeters after microwave plasma chemical vapor deposition growth. (d) Cross-sectional SEM image showing a typical aligned g-CNT film.
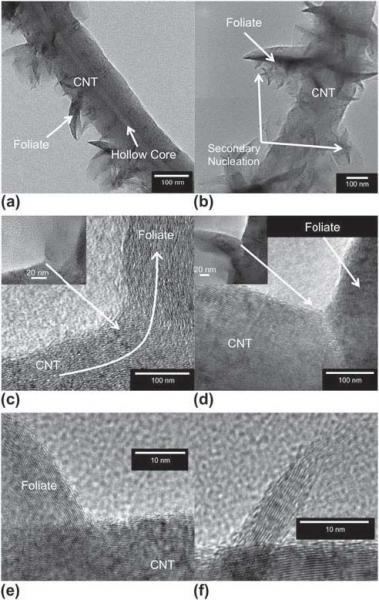
Transmission electron microscopy images of g-CNTs. (a) The hollow core of the nanotube shows graphene foliates in CNTs, rather than nanofibers (b) Secondary nucleation of graphene foliates is indicated by arrows. The presence of secondary nucleation indicates an active growth surface on the graphene foliates. (c) Coherent interface between CNT sidewall and graphene foliates. Inset: lower magnification image of same. (d) Incoherent interface between nanotube sidewall and the graphene foliates. Inset: lower magnification image of same. (e) Lattice fringes from CNT stem and graphene foliate are visible. The average of 11 fringes for the CNT and leaf gives values of 0.362 nm in the foliate and 0.351 nm for the CNT. This is consistent with a range of 0.345 to 0.365 nm for CNTs.23 (f) A foliate around 10 layers thick. As is typical for the foliates, it is thicker near the base where it is attached to the nanotube and gets thinner towards the edge.